Metamodel Matching Framework
Workflow and Experimental Setup

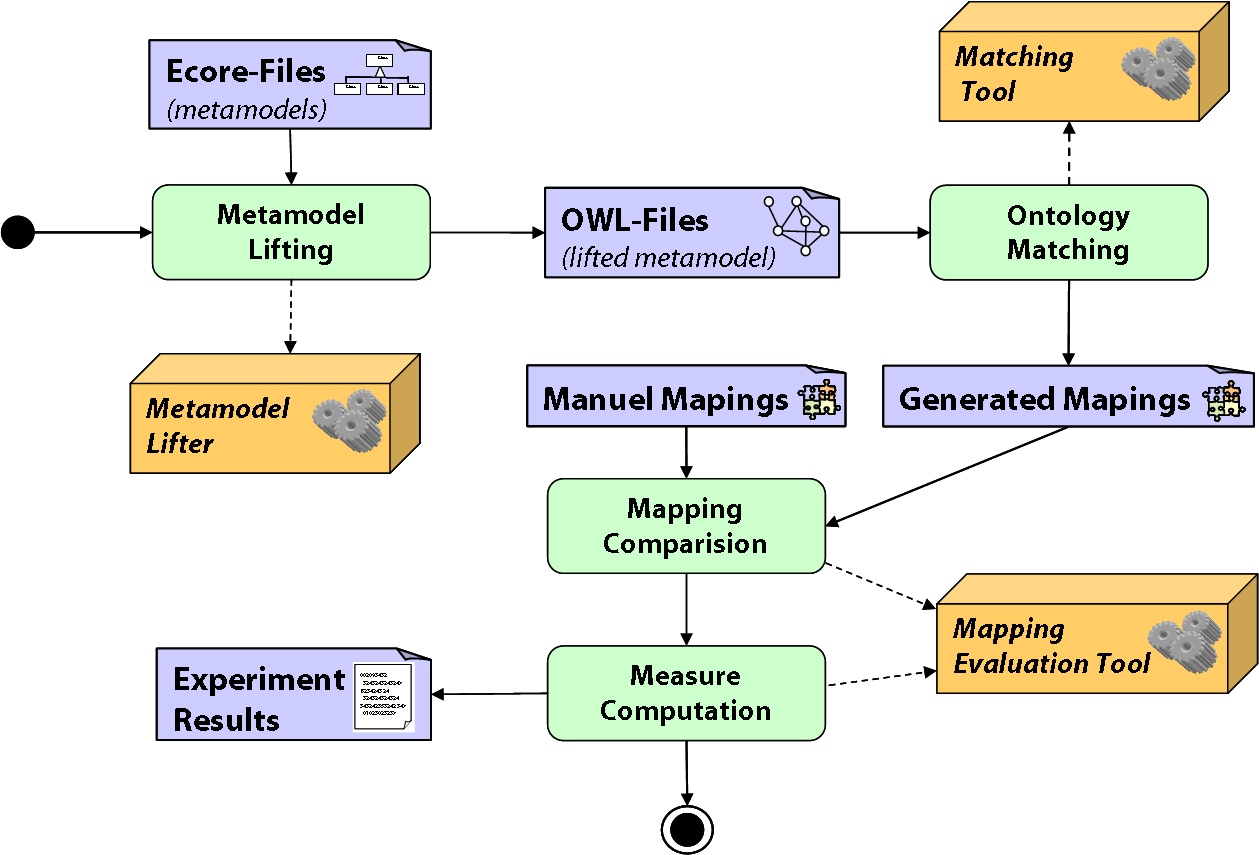
The first step in the framework is to lift ecore based metamodels into OWL Ontologies. This is only a shift of technical space,
from ModelWare to OntoWare, without adding additional semantic to the metamodels.
The next step is the automatic matching process with matching tools. This tools need as input parameter the lifted metamodels in OWL format.
As a result the matching tools produce a mapping file in INRIA alignment Format.
The next step is the evaluation of the automatically produced mappings. Therefore we made manual mappings form the metamodels and compare the
manual mappings with the automatic mappings in the Mapping Comparison process The Measure Computation
process calculates evaluation measures that be represented in the Experimental Results
Metamodels used during the matching tools evaluation
All metamodels are available as Ecore (XMI, PDF, Web2.0 MetaModelBrowser (MMB)) and OWL!
- UML 2.0 Class Diagram Metamodel
- Ecore Format
 ,
PDF
,
PDF  ,
view in Web 2.0 MMB
- OWL Format

- Ecore Format
- UML 1.4.2 Class Diagram Metamodel
- Ecore Format
 ,
PDF
,
PDF  ,
view in Web 2.0 MMB
- OWL Format

- Ecore Format
- ER Diagram Metamodel
- Ecore Format
 ,
PDF
,
PDF  ,
view in Web 2.0 MMB
- OWL Format

- Ecore Format
- Ecore Model
- Ecore Format
 ,
PDF
,
PDF  ,
view in Web 2.0 MMB
- OWL Format

- Ecore Format
- Webml Metamodel
- Ecore Format
 ,
PDF
,
PDF  ,
view in Web 2.0 MMB
- OWL Format

- Ecore Format
Manual mappings between the metamodels
The following archive file contains all manual mappings between each of the metamodels as xml file. Note that each of the mapping files conforms to the INRIA Alignment Format. An example mapping between the UML1.4 Class and UML2.0 Class is given below. The mapping type is equivalence (=) and the mapping has a probability of 0,75.
<Cell>
<entity1 rdf:resource='http://UML1.4#Class'/>
<entity2 rdf:resource='http://UML2.0#Class'/>
<measure rdf:datatype='http://www.w3.org/2001/XMLSchema#float'>0.74790245</measure>
<relation>=</relation>
</Cell>
A measure for the match quality
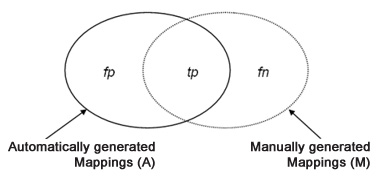
To measure the quality of the matching tools we reuse measures stemming from the field of information retrieval for comparing the manually determined matches M (also called relevant matches) to the automatically found matches A. The primary measures are precision and recall [SM87], whereas these measures are negatively correlated. Thus, we use a common combination of the primary measures, namely F-measure [vR79].
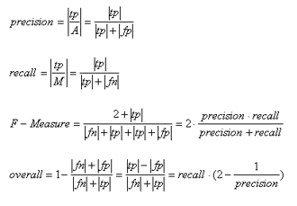
These measures are based on the notion of true positives (tp) (A ∩ M), false positives (fp) (false matches, f p = A ∩ ̄M where ̄M = |tn| + |f p|), and false negatives (fn) (missed matches, f n = M ∩ ̄A where ̄A = |f n| + |tn|). tn stands for true negatives. Based on the cardinalities of the sesets the afore mentioned measures are defined in [SM87],[vR79]as follows:
Precision reflects the share of relevant matches among all the automatically retrieved matches given by A. This measure can also be interpreted as the conditional probability P (M/A). A higher precision means, that the matches found, are more likely to be correct. If the number of false positives equals zero, all matches are to be considered correct.
Recall gives the frequency of relevant matches compared to the set of relevant matches M. Again this measure can be expressed as a conditional probability which is given by P (A/M ). A high recall states that nearly all-relevant matches have been found. Nothing is said about wrong matches contained in A.
F-measure takes both Precision and Recall into account to overcome some over- or underestimations of the two measures. Formally the F-measure is in our case the equally weighted average of the precision and recall measure.


The Evaluation Framework
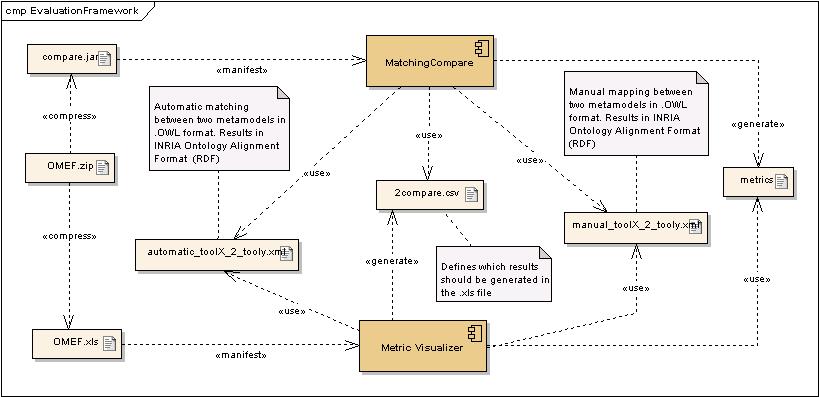
 To ease the evaluation process we have developed an evaluation framework, that consists of
two major components. The first one is the MatchingCompare (compare.jar) component and the second one is
the Metric Visualizer component. The matchingCompare component needs two input files,
the manual mapped Ontologies and the automatically mapped Ontologies. The results of the comparing task
were visualized with the help of an excel file (OMEF.xls).
How to use the framework
The framework is very simple to use. You can download the .zip file, extract it, open the excel file and press the button load results (attention: Macros must be enabled). The excel file leads each matching result from the folder MatchingResults and generates the sheets in the excel file and the diagrams if the check box with diagrams is selected. On the sheet Diagrammquellen is possible to generate the diagrams separately.
The matching form the matching tools have to be in the folder MatchingResults with a specific naming:
schema#1_2_schema#2_matcher.xmlschema#1_2_schema#2_matcher.xml
These name convention is necessary for the macros in the excel file to generate the sheets and the diagrams.
It is possible to influence the visualization of the matching results in the tables with parameters in the Parameter sheet.
Download
This ZIP File includes the framework. How to work with the framework is described above and in a readme file in the ZIP.
References
[SM87] Gerard Salton and Michael J. McGill. Information Retrieval. Grundlegendes fuer Informationswissenschaftler. McGraw-Hill, Maidenh, 1987.
[vR79] Cornelis Joost van Rijsbergen. Information Retrival. Online, 1979.


