


Metamodel Matching Experiment
Average Result of the Matching
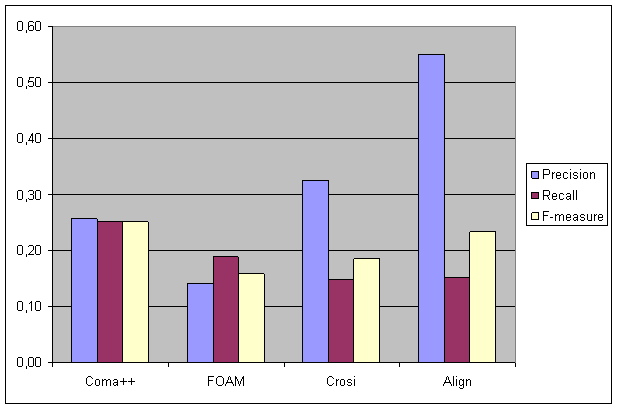
The average results depict the overall average of all metamodel mapping combinations for each of the evaluated matching tools. The high precision value of the Alignment API means that near 55% of the automatically found matchings are the right one, but only near 15% of the available matches are found. COMA++ instead has a more balanced result. Note that this values are aggregated over all results! The detail results of the evaulation can be found in the OMEF.xls dump. You can also download the Ontolgoy Matching Evaluation Framework, that inclued the OMEF.xls file.
You can download the results of all matching tasks in the INRIA Alignment Format in a single zip file:

Results of the Matching Tools
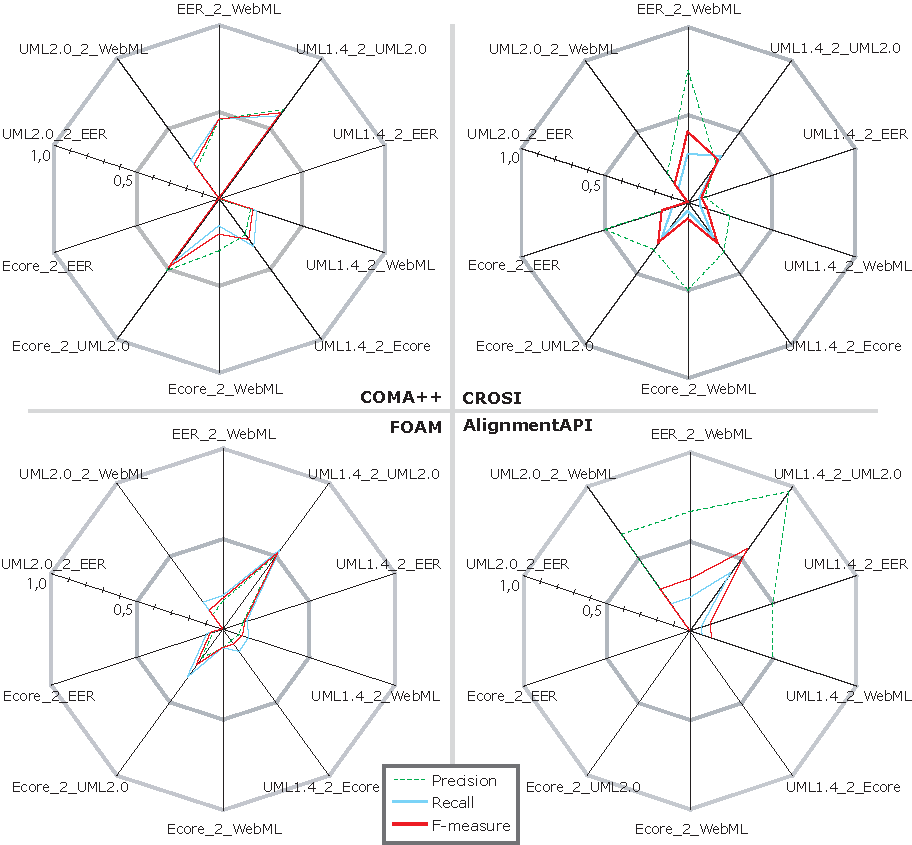
In the following we discuss the best and worst cases for our three measures when using the tools with their default settings. The highest precision value was achieved with Align- mentAPI for UML1.4 to UML2.0 (precision=0.96; recall=0.40; F-measure=0.57). The best recall and F-measure value was achieved with COMA++ for UML1.4 to UML2.0 (precision=0.63; recall=0.58, F-measure=0.61).
To calculate an average value of precision, recall and F-measure we set the measurement values to zero for the cases when the tools did not deliver results. The average is calculated as the geometric mean by summarizing all values and divide it by the number of possible matching results (10). Each measure has a range between zero and one therefore the assumption of zero for the tools which did not find any result is passable.
The best average precision was achieved by CROSI (precision = 0.33; recall = 0.15; F-measure = 0.18) and FOAM (precision = 0.33; recall = 0.09; F-measure = 0.14). 33% off ound mappings of CROSI and FOAM are correct but CROSI found 15% of the possible mappings instead of FOAM with 9%. Therefore the benefit (F-measure) of CROSI is better with 0.18 insteadof 0.14 from FOAM. Thebest average recall and F-measurewas achieved by COMA++ (precision = 0.26; recall = 0.25; F-measure = 0.25). With the precision of 0.26 and recall of 0.25 we have a balanced result.
In our evaluation we have also experimented with modified settings of the tools resulting in 13 different tool settings (four tools with standard settings + nine modifications). The best precision of the nine modifications was achieved for UML1.4 to UML2.0 with modified CROSI (precision = 1; recall = 0.29; F-measure = 0.45). Compared to the results of CROSI with standard settings (precision=0.27; recall=0.32; F-measure=0.30) we can say that the changes result in a much better result. All found mappings are correct and we found only 3% less as with CROSI with its default settings. The best recall and also the best F- measure was achieved with modified COMA++ for UML1.4 to UML2.0 (precision=0.69; recall=0.57; F-measure=0.62). This results do not differ so much from the results of COMA++ with default settings (precision=0.63; recall=0.58; F-measure=0.61)
If we examine the average of the three measures of the 13 tool versions, the best preci- sion over all integration scenarios was achieved with modified settings in CROSI (preci- sion=0.83). But the recall and F-measure is very low (recall=0.12 and F-measure=0.20). The found mappings are mostly correct, but there are many mappings left that were not found by the tool. The best recall was achieved with a modified version of COMA++ (recall=0.33). Although the low precision (precision=0.37), it leads also to the best F- measure (F-measure=0.34). The benefit of the matching results of COMA++ is much higher as the benefit of CROSI with its high precision. Summarizing, it can be said that modifying the settings often leads to a better precision but the higher the precision gets the lower is the value of the recall, i.e., it is hard to increase the F-measure value considerable.
Detailed results of the evaluation
The evaluation results are stored in the Excel file OMEF.xls. To get an insight of the results without downloading the whole matching framework you find a dump of the OMEF.xls transformed into an HTML page. Note, that this is only simple HTML. If you want to include you own results into the matching evaluation framework you have to download it.